
You might also like to know how programs know what you want before you do.
Written by Badreesh Shetty
Recommender systems are machine learning systems that help users discover new products and services. Every time you shop online, a recommendation system is guiding you towards the most likely product you might purchase.
A recommendation system is a subset of machine learning that uses data to help users find products and content. Websites and streaming services use recommender systems to generate “for you” or “you might also like” pages and content.
Recommender systems are an essential feature in our digital world, as users are often overwhelmed by choice and need help finding what they're looking for. This leads to happier customers and, of course, more sales. Recommender systems are like salesmen who know, based on your history and preferences, what you like.
Recommender systems are so commonplace now that many of us use them without even knowing it. Because we can't possibly look through all the products or content on a website, a recommendation system plays an important role in helping us have a better user experience, while also exposing us to more inventory we might not discover otherwise.
Some examples of recommender systems in action include product recommendations on Amazon, Netflix suggestions for movies and TV shows in your feed, recommended videos on YouTube, music on Spotify, the Facebook newsfeed and Google Ads.

An important component of any of these systems is the recommender function, which takes information about the user and predicts the rating that user might assign to a product, for example. Predicting user ratings, even before the user has actually provided one, makes recommender systems a powerful tool.
How Recommender Systems WorkRelationships provide recommender systems with tremendous insight, as well as an understanding of customers. There are three main types that occur:
The user-product relationship occurs when some users have an affinity or preference towards specific products that they need. For example, a cricket player might have a preference for cricket-related items, thus the e-commerce website will build a user-product relation of player->cricket.
Product-product relationships occur when items are similar in nature, either by appearance or description. Some examples include books or music of the same genre, dishes from the same cuisine, or news articles from a particular event.
User-user relationships occur when some customers have similar taste with respect to a particular product or service. Examples include mutual friends, similar backgrounds, similar age, etc.
In addition to relationships, recommender systems utilize the following kinds of data:
Users behavior data is useful information about the engagement of the user on the product. It can be collected from ratings, clicks and purchase history.
User demographic information is related to the user’s personal information such as age, education, income and location.
Product attribute data is information related to the product itself such as genre in case of books, cast in case of movies, cuisine in case of food.
Data can be provided in a variety of ways. There are two particularly important methods, explicit and implicit rating.
Explicit ratings are provided by the user. They infer the user’s preference. Examples include star ratings, reviews, feedback, likes and following. Since users don't always rate products, explicit ratings can be hard to get.
Implicit ratings are provided when users interact with the item. They infer a user’s behavior and are easy to get as users are subconsciously clicking. Examples include clicks, views and purchases. (Note: Views and purchases can be a better entity to recommend as users will have spent time and money on what is most crucial for them.)
Product similarity is the most useful system for suggesting products based on how much the user would like the product. If the user is browsing or searching for a particular product, they can be shown similar products. Users often expect to find products they want quickly and move on if they have a hard time finding the relevant product. When the user clicks on one product we can show another similar product, or if the user buys the product we can email the user advertisements or coupons based on a similar product. Product similarity is particularly useful when we don’t know much about the user yet, but we do know what products they're viewing.

User similarity is for checking the difference between the similarity of two users. If two users have similar preferences for a product we can assume they have similar interests. It’s like a friend recommending a product.

One shortcoming of user similarity, however, is that it requires all the user data to suggest products. It’s called a cold start problem because beginning the recommendation process requires previous data from users. A newly launched e-commerce website, for example, suffers from the cold start problem because it doesn't have a large number of users.
Product similarity doesn’t have this problem because it just requires product information and the user’s preference. Netflix, for example, avoids this issue by asking users their likes when starting a new subscription.
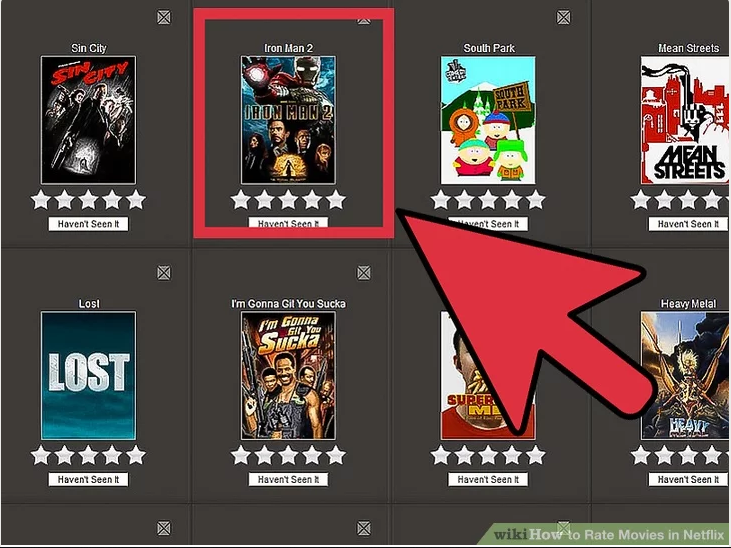
Similarity is measured using the distance metric. Nearest points are the most similar and farthest points are the least relevant. The similarity is subjective and is highly dependent on the domain and application. For example, two movies are similar because of genre or length or cast. Care should be taken when calculating distance across dimensions/features that are unrelated. The relative values of each element must be normalized, or one feature could end up dominating the distance calculation.
Minkowski Distance: When the dimension of a data point is numeric, the general form is called the Minkowski distance.

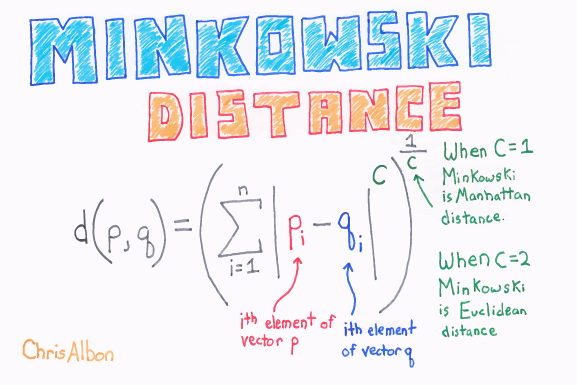
It is a generic distance metric where Manhattan(r=1) or Euclidean(r=2) distance measures are generalizations of it.
Manhattan Distance: The distance between two points measured along axes at right angles.

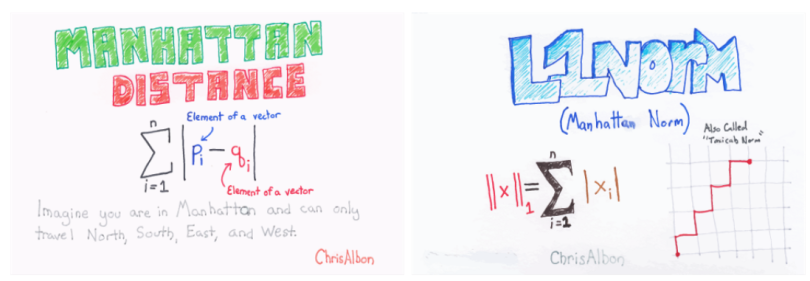
It is also called rectilinear distance, L1-distance/L1-norm, Minkowski’s L1- distance, city block distance and taxi cab distance.
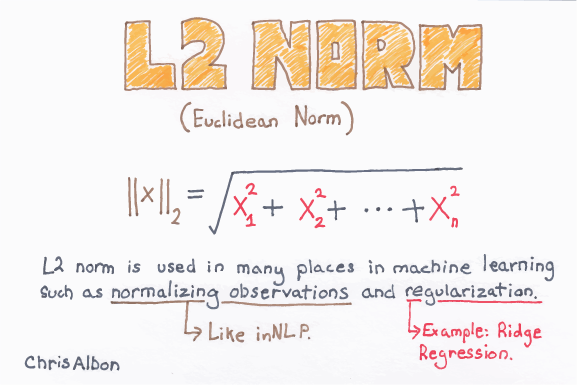
Euclidean Distance: The square root of the sum of squares of the difference between the coordinates and is given by Pythagorean theorem.


Cosine Similarity: Measures the cosine of the angle between two vectors. It is a judgment of orientation rather than magnitude between two vectors with respect to the origin. The cosine of 0 degrees is 1 which means the data points are similar and the cosine of 90 degrees is 0 which means data points are dissimilar.

Pearson Coefficient: It is a measure of correlation between two random variables and ranges between [-1, 1].
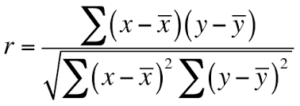
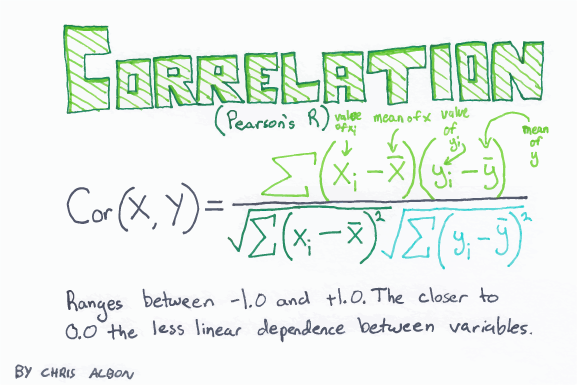
If the value is 1, it is a positive correlation, and if -1 then there is a negative correlation among variables.
Jaccard Similarity: In the other similarity metrics, we discussed some ways to find the similarity between objects, where the objects are points or vectors. We use Jaccard similarity to find similarities between finite sets. It is defined as the cardinality of the intersection of sets divided by the cardinality of the union of the sample sets.

Hamming Distance: All the similarities we discussed were distance measures for continuous variables. In the case of categorical variables, Hamming distance must be used.
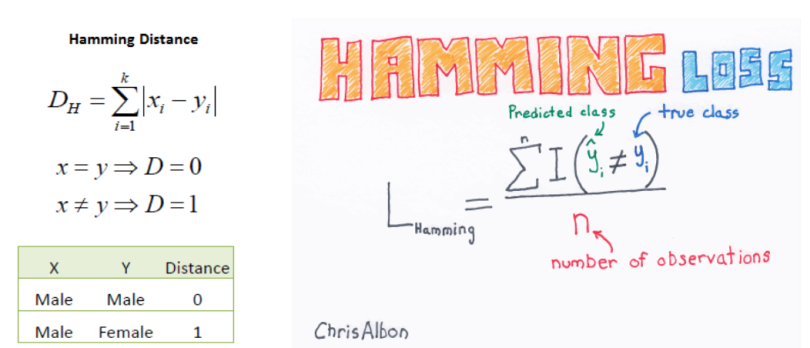
If the value (x) and the value (y) are the same, the distance D will be equal to 0, otherwise D=1. If we have data that is binary (i.e., classification), one would go for Hamming distance. The lower value means high similarity and higher value means less similarity between variables. For example, the Hamming distance between 1101111 and 1001001 is 3, while the Hamming distance between ‘batman’ and ‘antman’ is 2
Content-based recommendation systems use their knowledge about each product to recommend new ones. Recommendations are based on attributes of the item. Content-based recommender systems work well when descriptive data on the content is provided beforehand. “Similarity” is measured against product attributes.
Suppose I watch a movie in a particular genre, then I will be recommended movies within that specific genre. The movie's attributes, like title, year of release, director and cast, are also helpful in identifying similar movie content.
In this approach contents of the product are already rated and based on the user’s preference, then a rating is predicted for a similar product. We'll use movie recommendations as an example.

In the example above, Clark and Bruce have given five-star ratings to the movies Interstellar and The Shining, clearly indicating a preference for these films. For Tony, who has rated nothing, and Steve who has provided only low ratings, it's more difficult to discern their preferences.

In the table above, note that Interstellar and Inception received 5s in the science category, whereas The Shining and Alien get the highest marks under the horror genre.

Inception is suggested for Clark because he liked Interstellar and the movies share similar attributes. Alien is suggested to Bruce because he liked The Shining, which is in the horror genre.
Advantages: Works even when a product has no user reviews.
Disadvantages: Requires descriptive data of all content to recommend, which is time consuming. It's also difficult to implement on large product databases as user’s have different opinions about each item.
This approach uses the description of the item to make recommendations. The description goes deeper into the product details, like title, summary, tag lines, genre, etc., and it provides much more information about the item. The format of these details are in text format(string) and it's important to convert this into numbers to easily calculate for similarity.
TF-IDF is used in information retrieval for feature extraction purposes and it is a sub-area of natural language processing (NLP).
Term Frequency: Frequency of the word in the current document to the total number of words in the document. It signifies the occurrence of the word in a document and gives higher weight when the frequency is more, so it is divided by document length to normalize.

Inverse Document Frequency: Total number of documents to the frequency occurrence of documents containing the word. It signifies the rarity of the word — the less the word occurs in the document, the IDF increases. It helps in giving a higher score to rare terms in the documents.
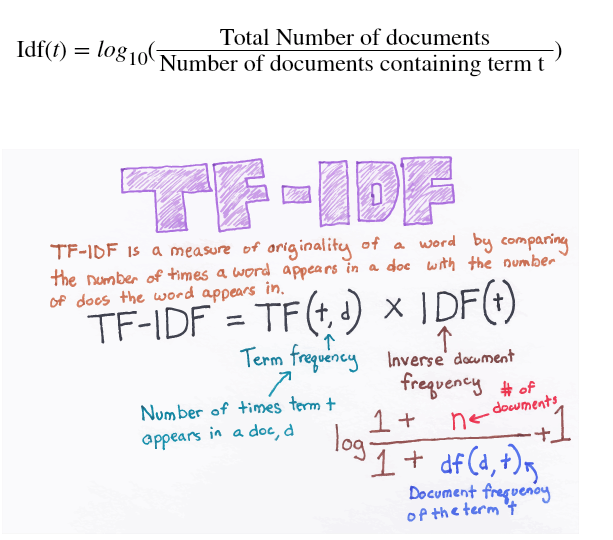
In the end, TF-IDF is a measure used to evaluate how important a word is to a document in a document corpus. The importance of the word increases proportionally to the number of times a word appears in the document but is offset by the frequency of the word in the corpus.
Example for TF-IDF: Consider a document containing 100 words wherein the word "odyssey" appears three times. The term frequency for odyssey is then (3 / 100) = 0.03. Now, assume we have 10 lakh documents and the word "odyssey" appears in 1,000 of these. The inverse document frequency is calculated as log(10,00,000 / 1,000) = 3. Thus, the TF-IDF weight for Odyssey is 0.03 * 3= 0.09.
Collaborative filtering recommenders make suggestions based on how users rated in the past and not based on the product themselves. It only knows how other customers rated the product. “Similarity” is measured against the similarity of users.

Going back to our movie example earlier, we can illustrate this technique.


Clark is recommended "Alien" from Tony because of their similarity in rating. Bruce was suggested "The Shining" because Steve rated it highly.
Advantages:
No requirement for product descriptions.
Disadvantages:
Most collaborative recommender systems perform poorly when dimensions in data increases (i.e., they suffer from the curse of dimensionality). It is a good idea to reduce the number of features while retaining the maximum amount of information. Reducing the features is called dimensionality reduction. Often while reducing we can get a useful part of the data, that is hidden correlation (latent factors) and remove redundant parts. There are many dimensionality reduction algorithms such as principal component analysis (PCA) and linear discriminant analysis (LDA), but SVD is used mostly in the case of recommender systems. SVD uses matrix factorization to decompose matrices.

In the case above, A matrix(m*n) can be decomposed into U(m*m) orthogonal matrix, Σ(m*n) non-negative diagonal matrix, and V (n*n) orthogonal matrix

U is also referred to as the left singular vectors, Σ as singular values, and V as right singular vectors
Let’s take the example of movies rated by users in matrix A:

For Σ, the first diagonal entry represents the weight (strength) of the sci-fi category (12.4) and the second diagonal entry represents the weight (strength) of the romance category (9.5). And as for the third diagonal entry, it is considered noise because the value is lower compared to other diagonal entries.
For V, the columns show the similarity of movies to a category. So, we can see from the first column of V that the first movie belongs to the sci-fi (0.56) category. Similarly, since the third row is discarded as noise the second movie also belongs to the sci-fi category.
After eliminating the third column from U, third row and third column from Σ, and third row, we get the below matrices.
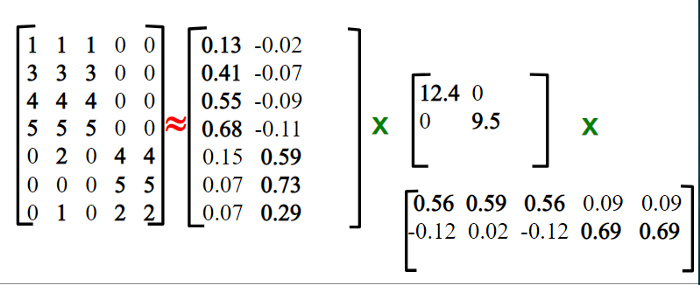
We have reduced the initial UΣV dimension, so to check if we've lost any information we need to multiply all three matrices.
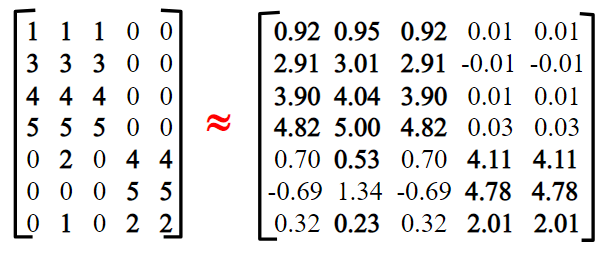
After multiplying we see there is very little loss of information as the elements of a matrix are very similar. It is similarly used for predicting missing values among ratings and suggesting high ratings to the user.
So this is how we decompose a matrix without losing much of the important data and It helps to analyze and acquire important information concerning the matrix data.
Hybrid recommender is a recommender that leverages both content and collaborative data for suggestions. In a system, first the content recommender takes place as no user data is present, then after using the system the user preferences with similar users are established.
For example, Netflix deploys hybrid recommenders on a large scale. When a new user subscribes to their service they are required to rate content already seen or rate particular genres. Once the user begins using the service, collaborative filtering is used and similar content is suggested to the customer.
Association rules learning is used for recommending complementary products. It helps in associating one product with another product and tries to answer which products are associated with one another. It is mostly used in e-commerce as user’s tend to buy a product paired with the main product.
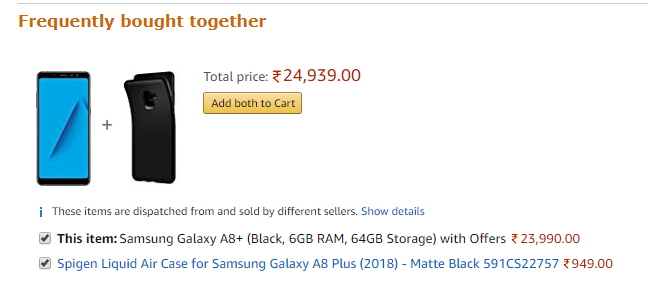
For example, cases are complementary to smartphones so it is recommended to the user.
Code:

Importing the MovieLens dataset and using only title and genres column


Using TfidfVectorizer to convert genres in 2-gram words excluding stopwords, cosine similarity is taken between matricies which are transformed. Generating recommendations based on similar genres and having high cosine similarity.

Based on the genre of "The Dark Knight" (i.e., action, crime, drama, IMAX), closely similar genres are recommended.
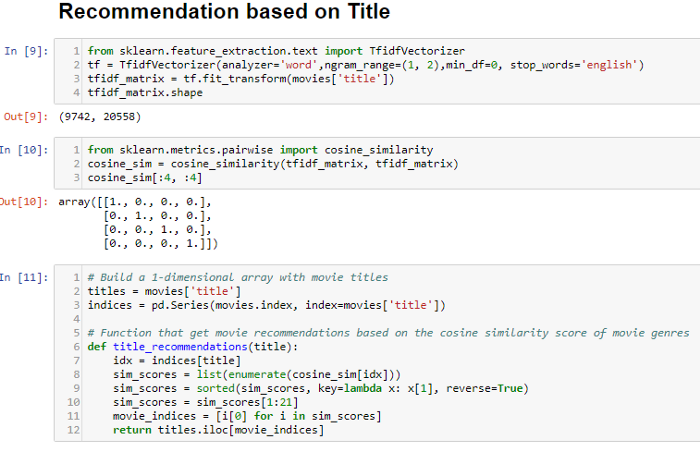
Using TfidfVectorizer to convert titles in 2-gram words excluding stopwords, cosine similarity is taken between matricies which are transformed. Generating recommendations based on similar genres and having high cosine similarity.


Importing dictionaries with values for user rating on movies.

Common movies are found in the reviews of each user and based on common movies the reviews are found on each movie.
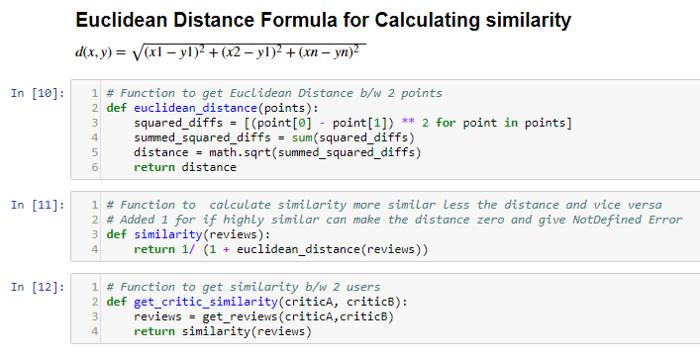
Euclidean distance is calculated between the common movies between users. The similarity is indirectly proportional to distance. As the distance increases, similarity decreases and vice versa. Critic similarity is used to the fine similarity of users.

From above, we can see Martin Scorsese and Joe Pesci are very similar to each other as they have rated common movies very closely.
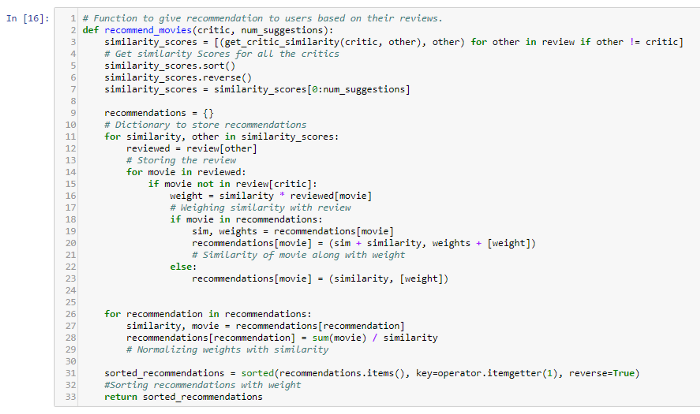
At first, all similarity scores are found out w.r.t to critics. Recommendation dictionary is given movie similarity and weight w.r.t each movie. The overall weight is normalized to make suggestions. Then recommended movies are sorted by weight.
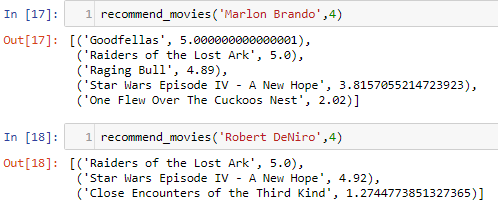
We can see from above Marlon Brando has rated "Godfather" high, "Goodfellas" is also rated highly where "Godfather" is rated highly, thus "Goodfellas" is recommended to Marlon Brando.
This is a very easy implementation of collaborative filtering, just the crux of the similarity between users is implemented. Whereas industry uses matrix factorization, autoencoders and deep learning.
Find the above code in this Github Repo.
References: Flashcards of Chris Albon from: https://machinelearningflashcards.com/
Recommender systems work behind the scenes on many of the world's most popular websites. E-commerce websites, for example, often use recommender systems to increase user engagement and drive purchases, but suggestions are highly dependent on the quality and quantity of data which freemium (free service to use/the user is the product) companies already have.
When we buy something or browse anything on Amazon, we see recommended products based on our taste or search results on the page.

As we can see above, I may have searched for products related to Sudha Murthy, but Amazon clusters it into segments based on other previous search results. A recommender system often biases the user’s opinion.
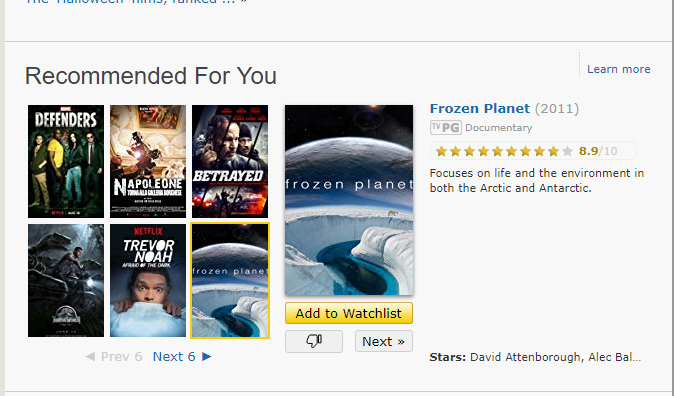
When we rate a TV show or movie on IMDb it recommends other shows or movies based on important details like cast, genre, sub-genre, plot and summary.
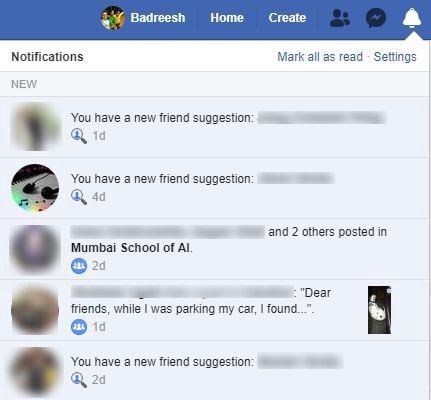
Often in the news feed section, the user is bombarded with articles similar to one another based on the likes and pages they follow. Some argue it creates an unconscious bias among the user, which may be bad or useful depending on how the user interprets something when they have only one side of the argument.
PS: I seldom use Facebook.
YouTube recommends videos based on previous viewing or clicks.
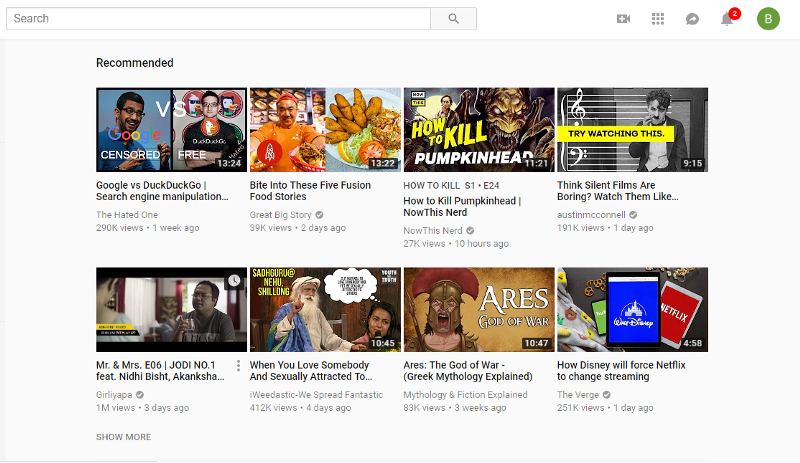
As we can above, the first video is about Google. While I've seen the video, YouTube recommends it to me to watch again. Basically, YouTube knows my likes and dislikes or bias (inclination).
Whenever we are logged in and search for anything on Google, it's registered in our history and recommends products based on previous searches. Not surprisingly, more than 90% of the company's revenue is generated through advertising. Relevant searches also take into account the location of the user.

When clicking on the sponsored button, Google shows us why these ads are targeted.

From the above we can see we were targeted with these ads based on recent search results.
PS: I use ublock origin but for this article, I unblocked Google to track my activities.

Gmail’s Sponsored Ad
Gmail recommends advertisements based on my inbox and the newsletters I’ve signed up for and the tags they may have generated.
Other examples of recommender systems at work include movies on Netflix, songs on Spotify and profiles on Tinder.

In George Orwell’s classic novel 1984, "Big Brother" is a government that scrutinizes each and every move of its citizenry. In today's world, tech companies like Google and Facebook more accurately fill that role. Each company has immense troves of data about millions of user’s and they harvest it for ad targeting and building things like recommender systems.
Most large tech companies offer their services for free, so you are the product. For example, Facebook is releasing ads on Whatsapp. So, Facebook knows your likes, preferences, bookmarks, followers on Instagram, etc. — and they culminate all of that data and target you on Whatsapp.
In the end, less is more, and if consumers feel like a company knows too much about them, they probably do.
Personalized content or services can be an addiction or menace depending on your point of view. It can help us find things we like, but it can also create an unconscious bias among users. Personalization helps us have a better customer user experience, but it's a tradeoff and we need to find a sweet spot between privacy and personalization .
I'll end with a couple of important quotes:
“Data is the new oil. It’s valuable, but if unrefined it cannot really be used. It has to be changed into gas, plastic, chemicals, etc to create a valuable entity that drives profitable activity; so must data be broken down, analyzed for it to have value.” — Clive Humby, UK mathematician and architect of Tesco’s Clubcard, 2006
“The difference between oil and data is that the product of oil does not generate more oil (unfortunately), whereas the product of data (self-driving cars, drones, wearables, etc) will generate more data (where do you normally drive, how fast/well you drive, who is with you, etc).” — Piero Scaruffi, cognitive scientist and author of “History of Silicon Valley”, 2016